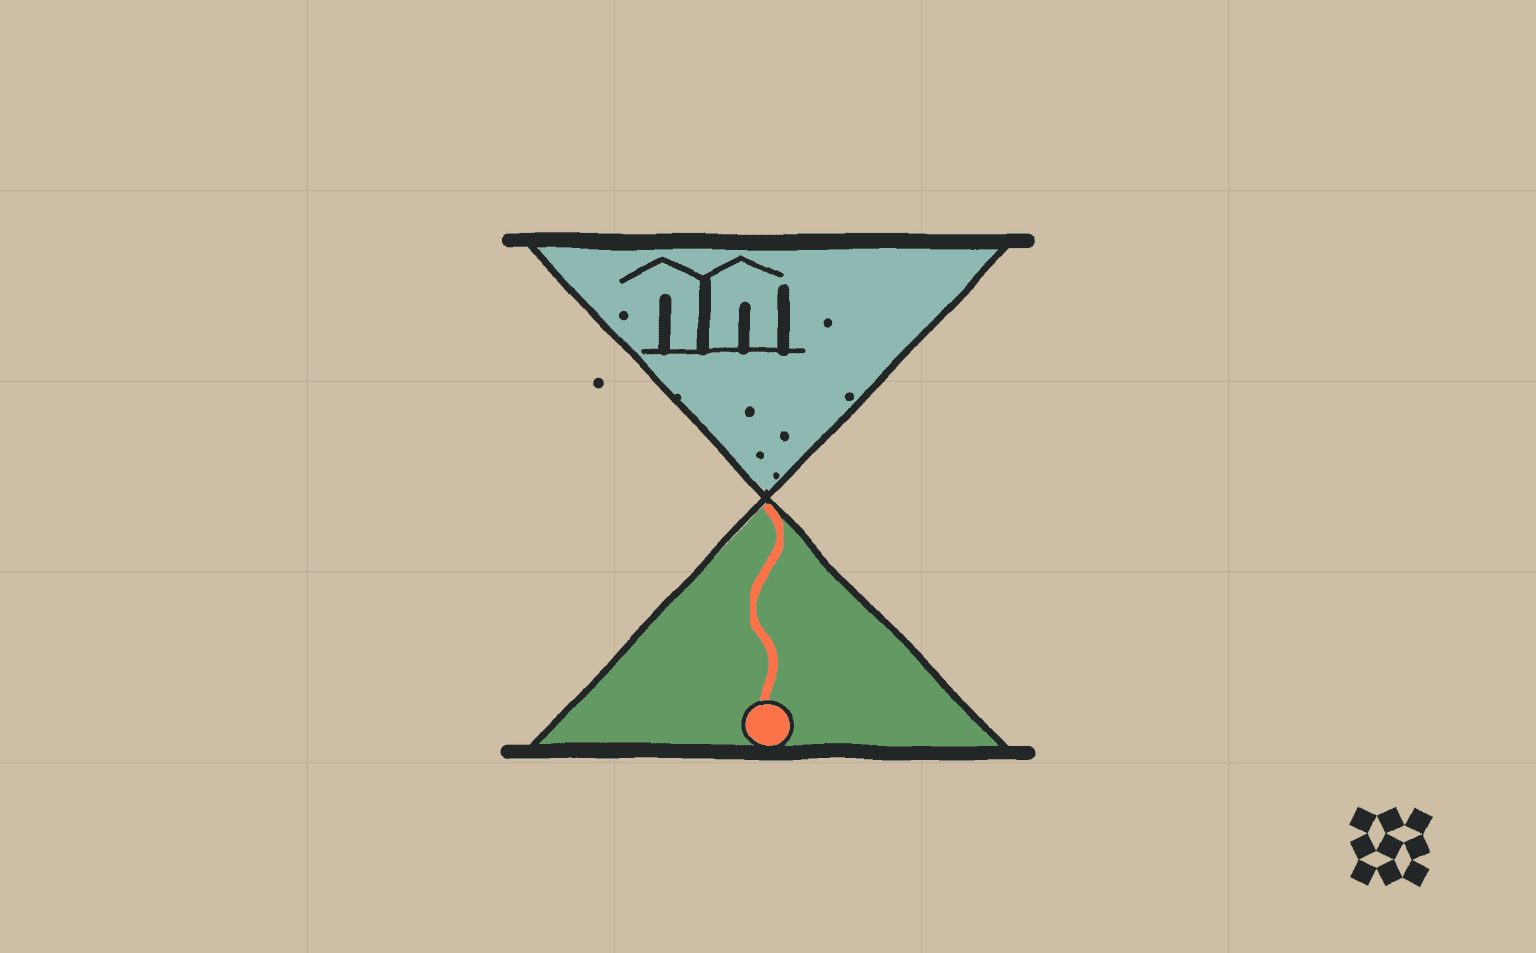
Dashboards Were a Workaround
BI tools are getting commoditized. And dashboards are the first thing to go.
Before the BI mob shows up, hear me out. 👀
For the last 20 years, analytics has meant one thing: dashboards. If you wanted to understand your business, you opened Tableau, Looker, or PowerBI and clicked around hoping someone had already built the report you needed. Alex and I have lived in that world, and it sucks. You wait for charts to load. You rebuild dashboards because someone asked a slightly different question. You write SQL just to answer something that should take 10 seconds.
The whole system was built around a single assumption: querying data is hard.
Because querying data was hard, analysts had to pre-build answers. Dashboards became those answers - static views of questions someone thought people might ask. But that assumption just broke. Making charts is trivial now, writing SQL is trivial now, and LLMs can generate high-quality visualizations in seconds.
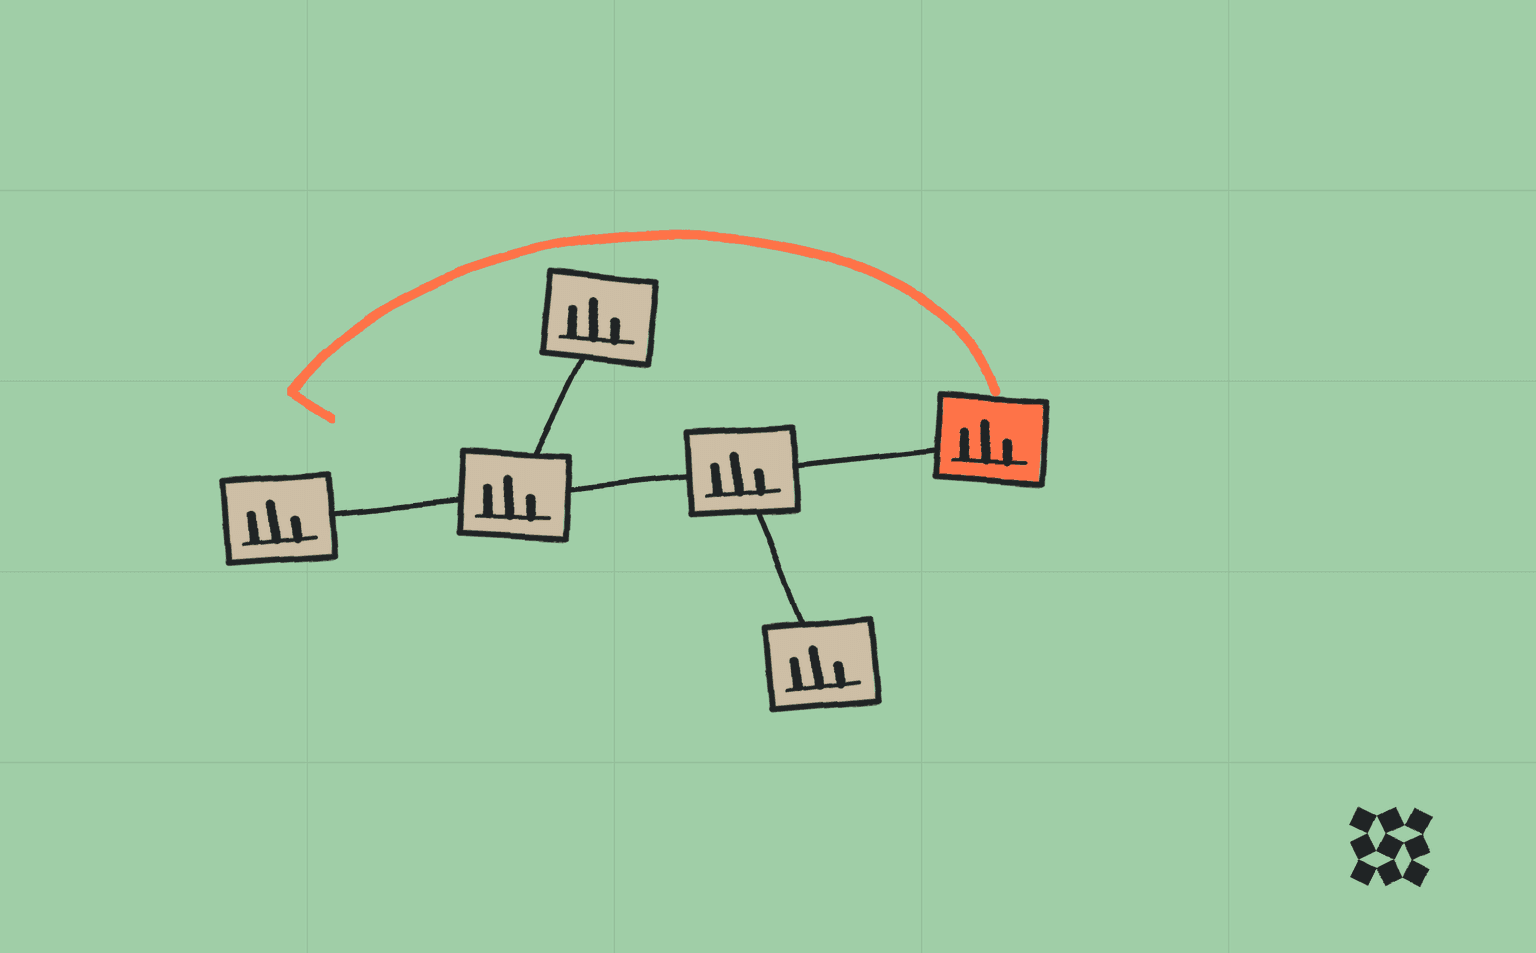
So the real question for analytics tools isn’t "Can you build a dashboard?" anymore - it’s "Can you explore a business problem?" Those are completely different products. Dashboards are static; business questions are dynamic. When you’re actually trying to understand what’s happening in a company, the workflow looks nothing like clicking through tabs on a report. You ask a question, you see something interesting, you pivot dimensions, you slice metrics differently, you pull in another dataset, and you compare across systems. It’s a conversation with the business, not a dashboard.
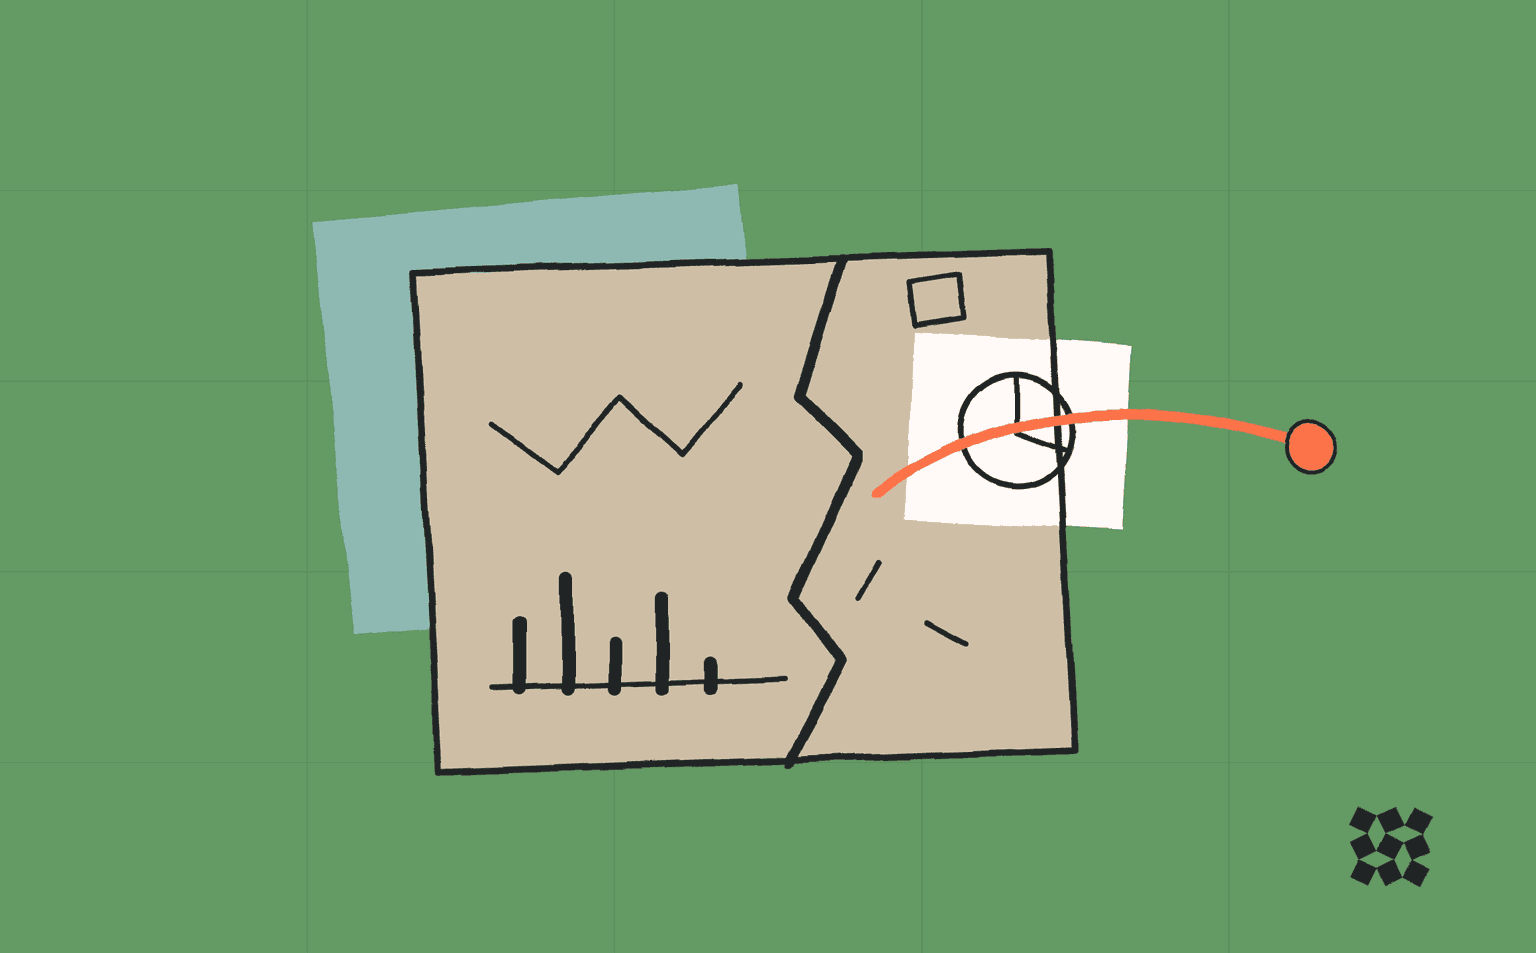
That’s why over the past two weeks we completely rebuilt Structify’s visualization engine. Instead of static dashboards, visualizations now generate dynamically as you explore questions across your business. You can:
- Pivot dimensions instantly
- Slice metrics across systems
- Generate visualizations mid-conversation
- Iterate on questions in seconds
The speed, complexity, and feel is fundamentally different from “pretty charts.” Because the future of BI isn’t dashboards. It’s interactive reasoning about your business, and that requires a completely different kind of visualization engine. We think we just built one of the most flexible ones on the market